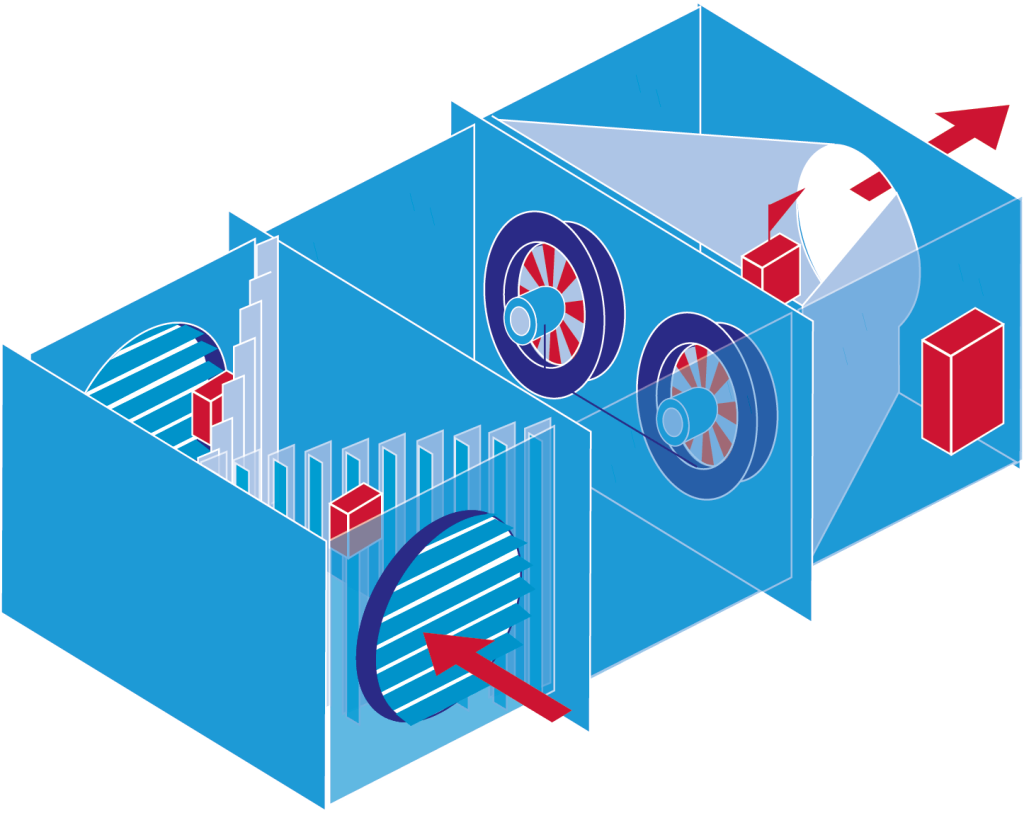
Graphics and diagrams that explain and reveal data and concepts.
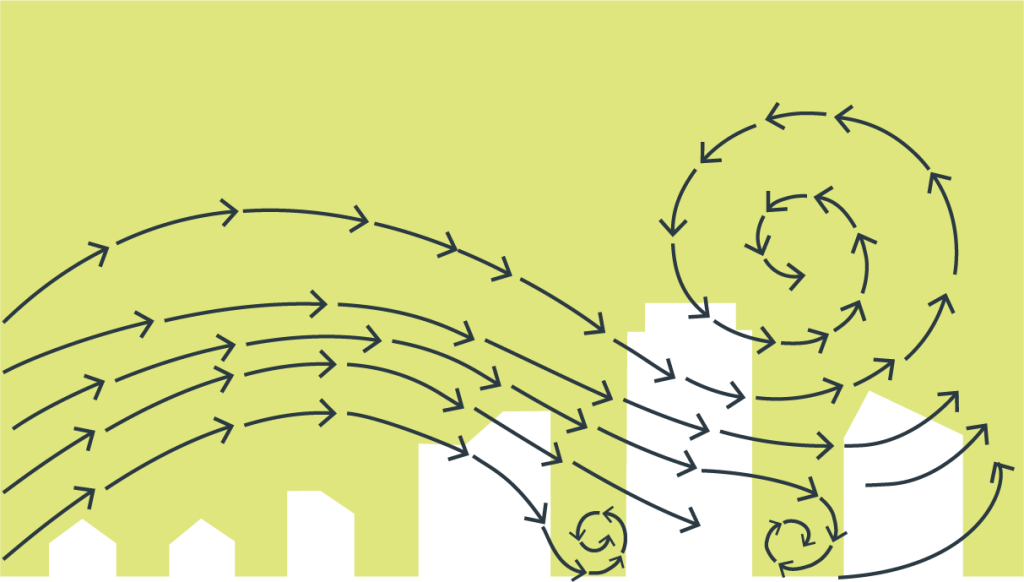
Part of a series of graphics to show environmental impacts on or from buildings.



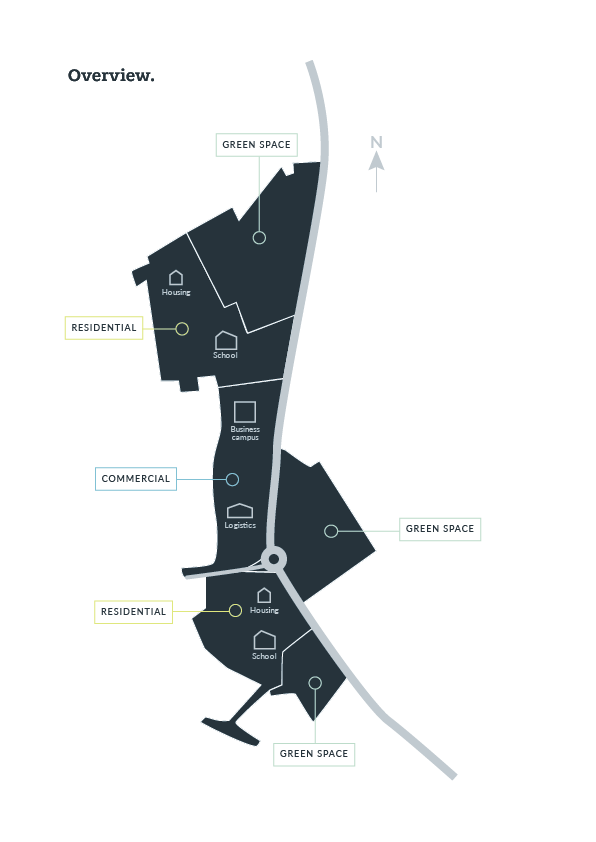
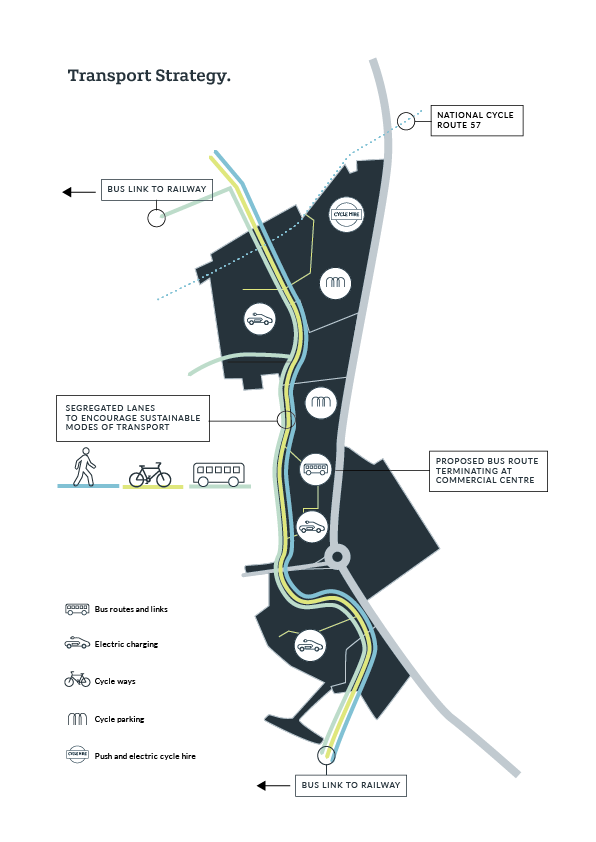
Series of maps to show sustainable and people centric approach to new developments.
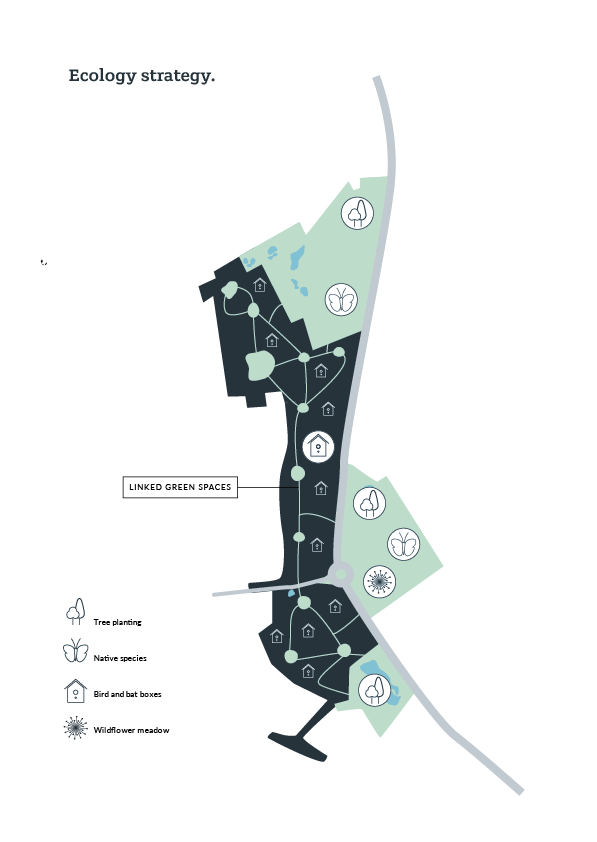
Net zero building graphics.


Selection of icons for building engineering.














Website interface for technical datasheets and reusable content.

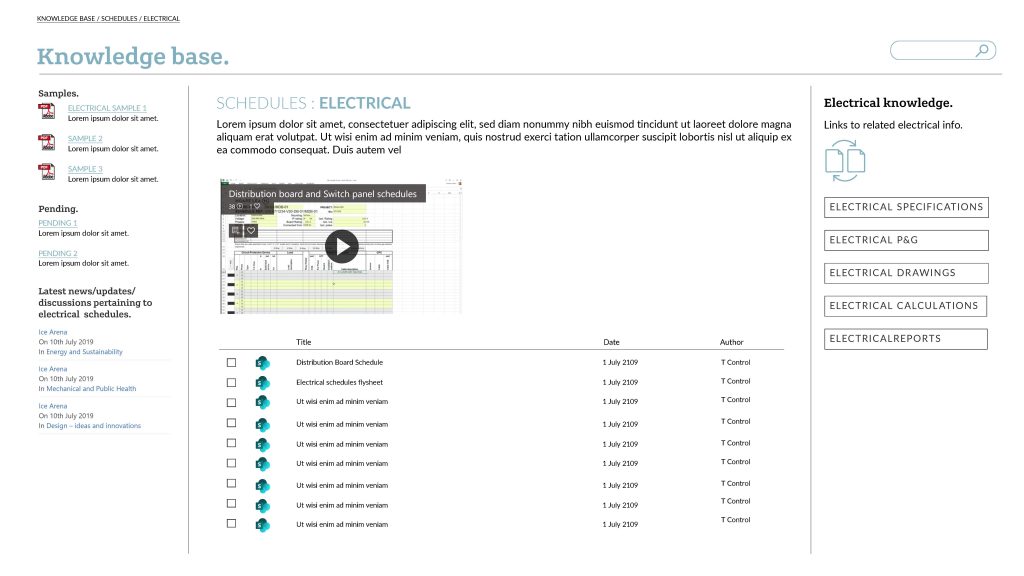
Graphics identifying engineering datasheets types.